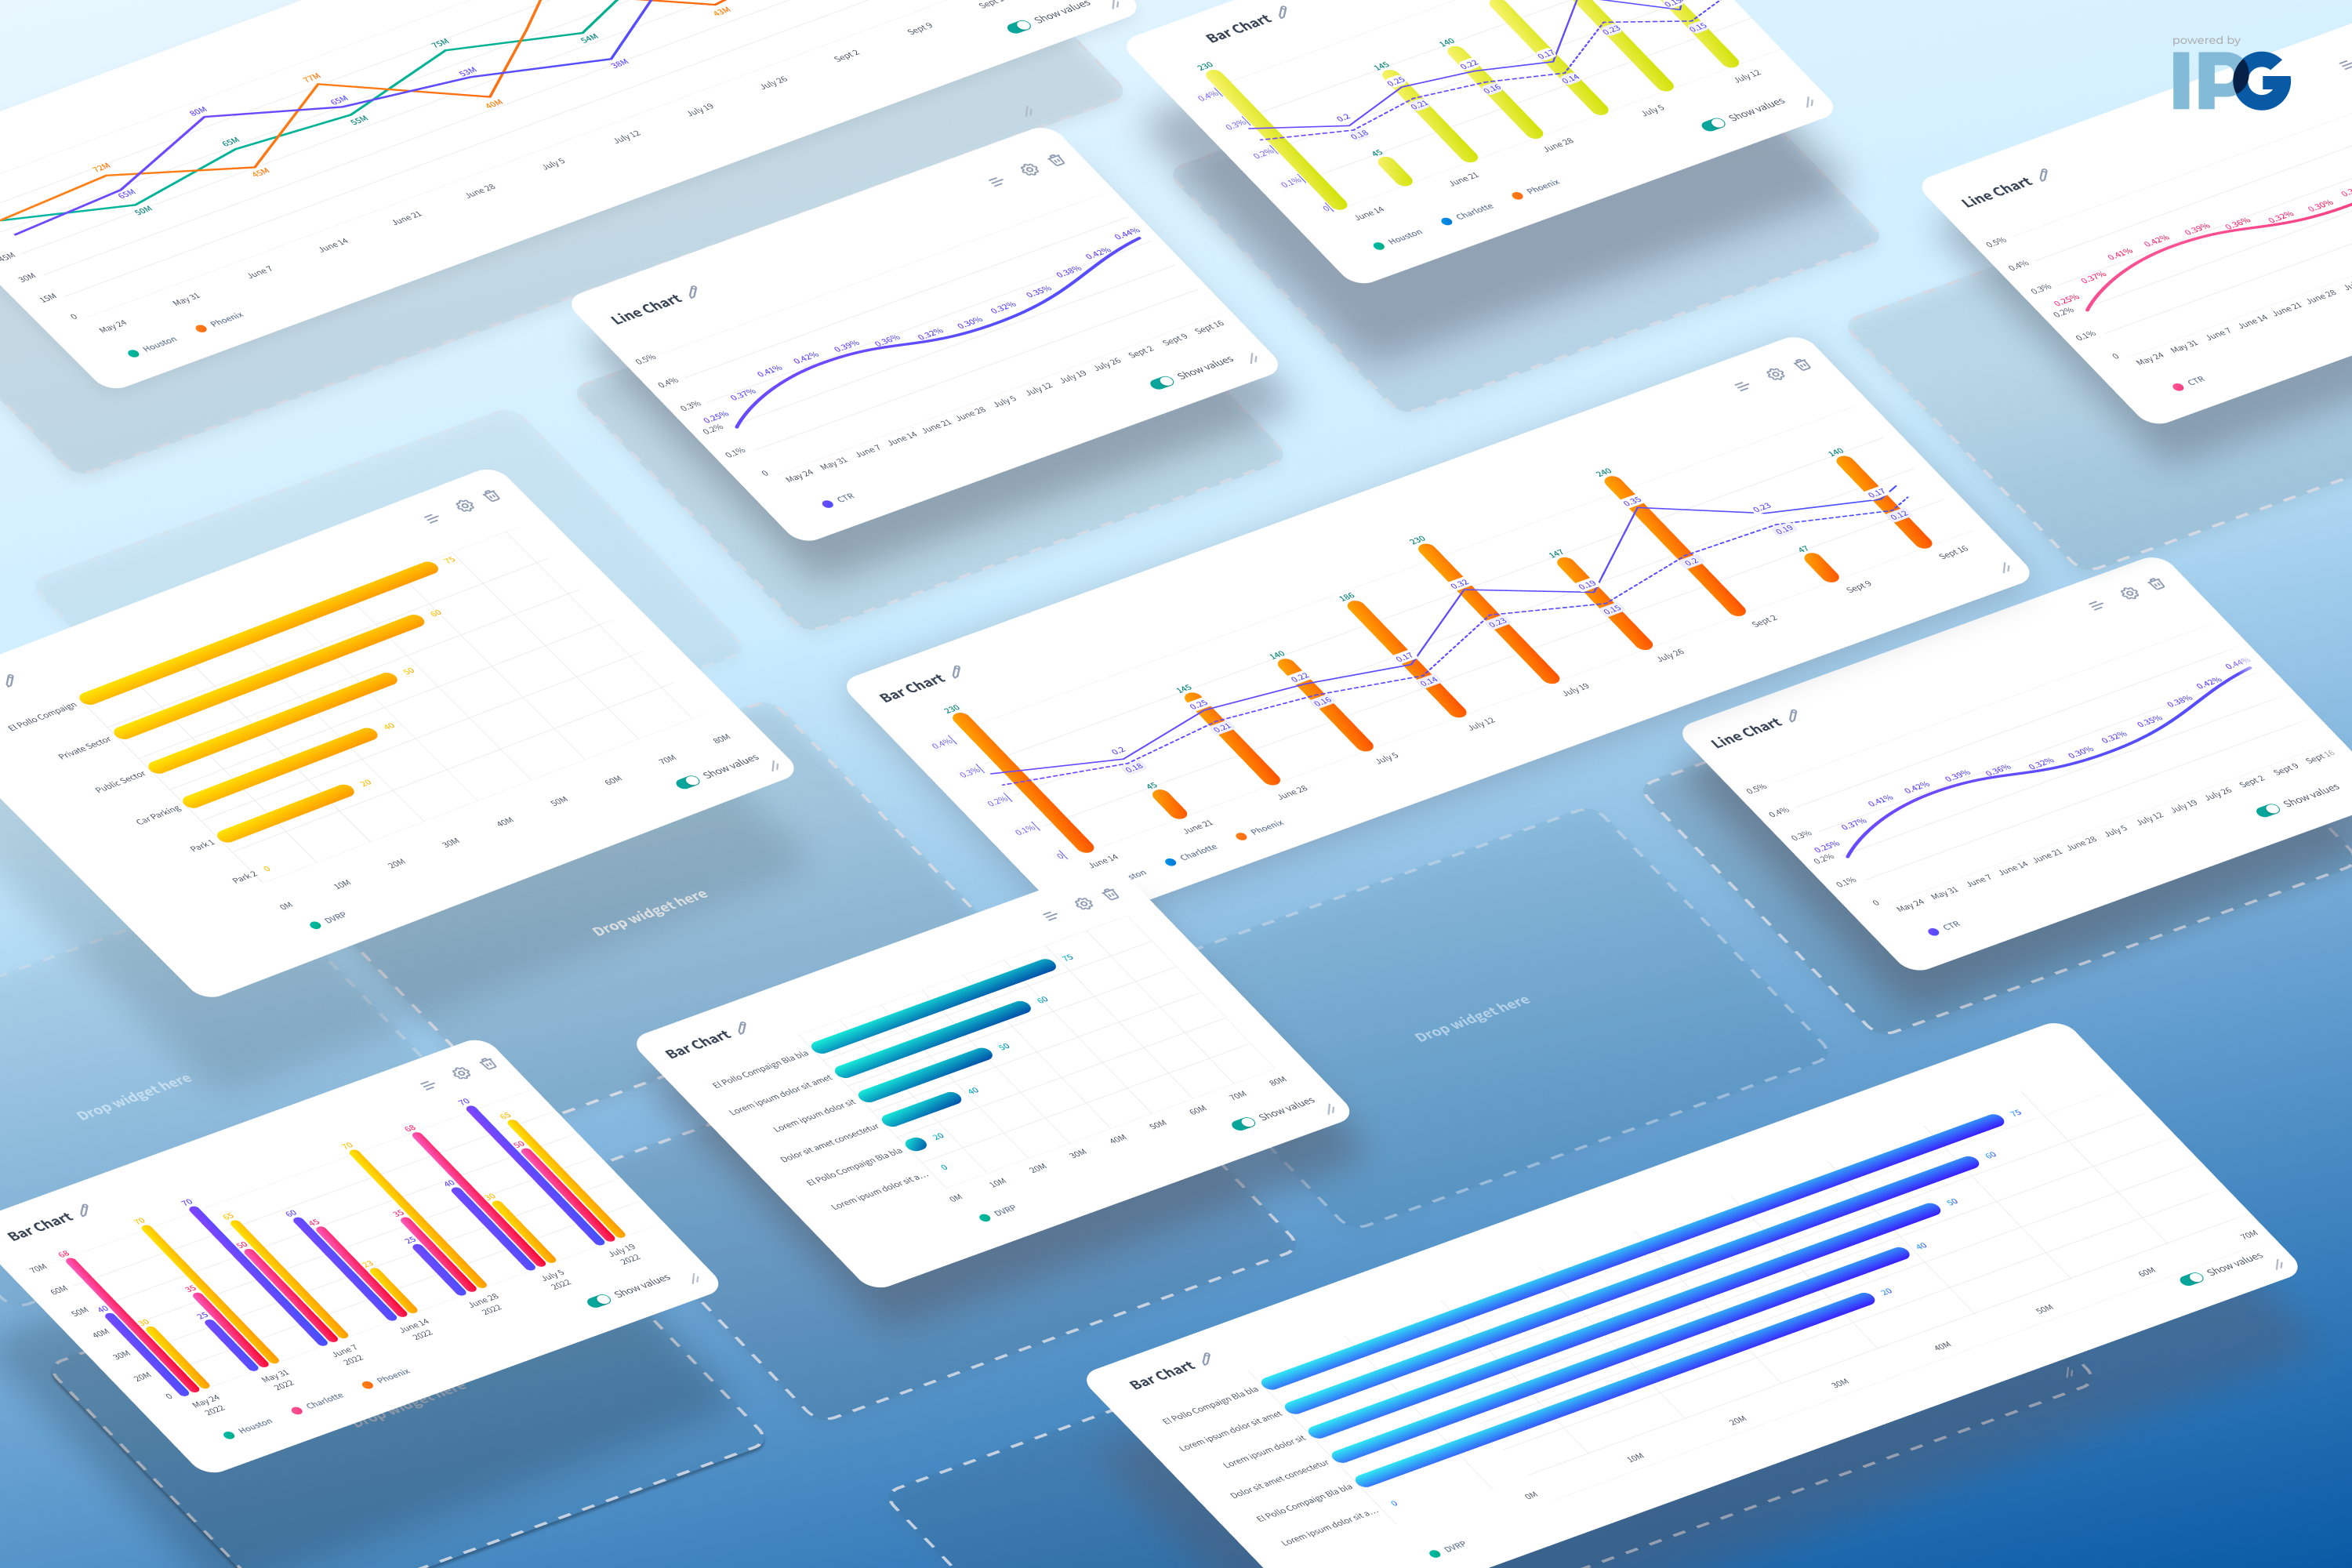
As Kinesso’s Product Design Team, we are always looking to help our users create personalized data stories through accessibility, branding, and customization options. Fueled by research, these options solve user needs, wants, and challenges for our 7,000+ users across 22+ agencies and partners of IPG's Marketing Intelligence Engine (MIE). Data visualizations were a key catalyst in creating our new design system – as we found users needed charts that were both insightful and beautiful to analyze and learn about how marketing and media efforts were performing – and to share with teammates and leaders. Through our iterative design process, we built innovative personalization, accessibility, and automated styles into our data visualization solutions that ultimately provide intuitive, delightful, and flexible options for any user type at scale.
The global styles color picker solution gives users the ability to customize data color themes applied to charts and graphs in any product, across the MIE platform. Built on the foundation of our in-house design system, the experience enables MIE users to easily switch between themes and color palettes with low friction and seamless flexibility. Applying our proprietary design formula, users can generate 3 color palettes - Monochromatic, Complementary, Analogous - for any of the 22 private label primary colors. As a result, this solution reduces incorrect assumptions and manual user effort to align reports and charts exported to brand or client guidelines using the limited features available in PowerPoint or Keynote.
Kinesso’s Product Design Team’s dashboard personalization solution allows marketers, analysts, and other MIE users to customize their own personal views of data – what data is displayed, how it is displayed, and where it is displayed. The creation of a modular-based dashboard design with drag-and-drop widgets lets users easily resize and reorganize the interface efficiently. In addition, these new features and visualizations have had no impact on performance or load times. This solution not only benefits our user base, but also opens new collaboration possibilities for our Design and Development teams. Both teams can now create more innovative and scalable components in shorter amounts of time.
Accessibility is top-of-mind in our commitment to innovating and designing for our 45 user types across our 22 private label clients. Intensive usability research uncovered key design opportunities to improve the readability and consumption of charts and graphs, especially in color, contrast, patterns and data labels. We incorporated a global extension allowing users to adjust font sizing, color contrast, enlarge content, use highlight cursors, and much more. This gives users customization options necessary to render data visualizations that meet their specific needs.
With these scalable design and accessibility solutions, our MIE platform now offers our users even more possibilities to create beautiful, elevated, and impactful data-driven stories for their brands and partners through connected intelligence experiences.